Full Text
Background
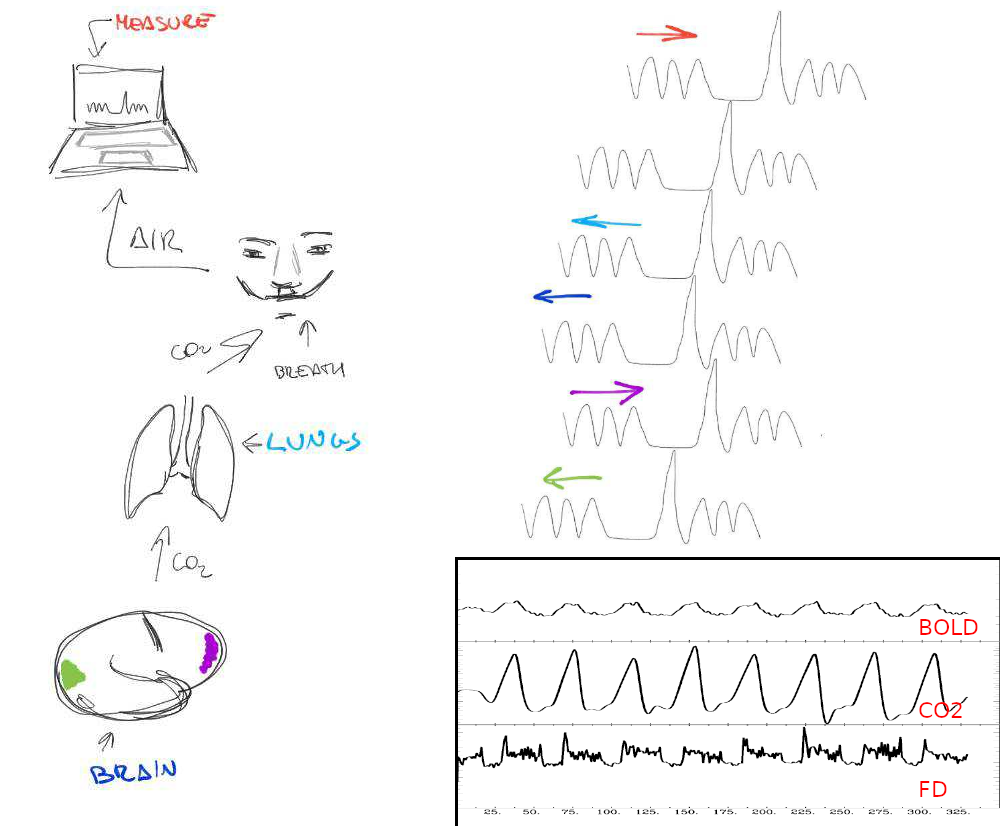
Cerebrovascular reactivity (CVR) measures the ability of the brain’s vasculature to respond to a vasodilatory stimulus, such as CO2 , and is an emerging imaging metric of cerebrovascular health. Breath-Hold (BH) induced CVR mapping is a valid alternative to gas inhalation challenges [1] with functional MRI. Although BH is non-invasive, highly tolerable, and relatively easy to implement, BH-derived CVR maps can be confounded by task-correlated movement, large vessel signals, and variability in task performance. This makes it challenging to explore true variability in the CVR response, both across grey matter and across timepoints. To our knowledge, no previous work has evaluated the variability of CVR estimates across beyond two scanning sessions. Alternatively, resting state fMRI data can be used to estimate CVR [2,3] with reduced concern over the aforementioned confounds. Resting State Fluctuation Amplitude (RSFA) is generally associated with physiological responses [4]. However, these surrogate metrics may not map identical vascular parameters, and may not reflect the same underlying brain physiology. In this study, we present the first longitudinal study comparing BH and RS CVR maps over 10 sessions, spaced one week apart, using multi-echo acquisition to minimize noise artifacts and increase BOLD sensitivity. We assess the variability in these CVR estimates over time, and compare patterns in CVR across grey matter with known spatial patterns of functional neural networks.
Methods
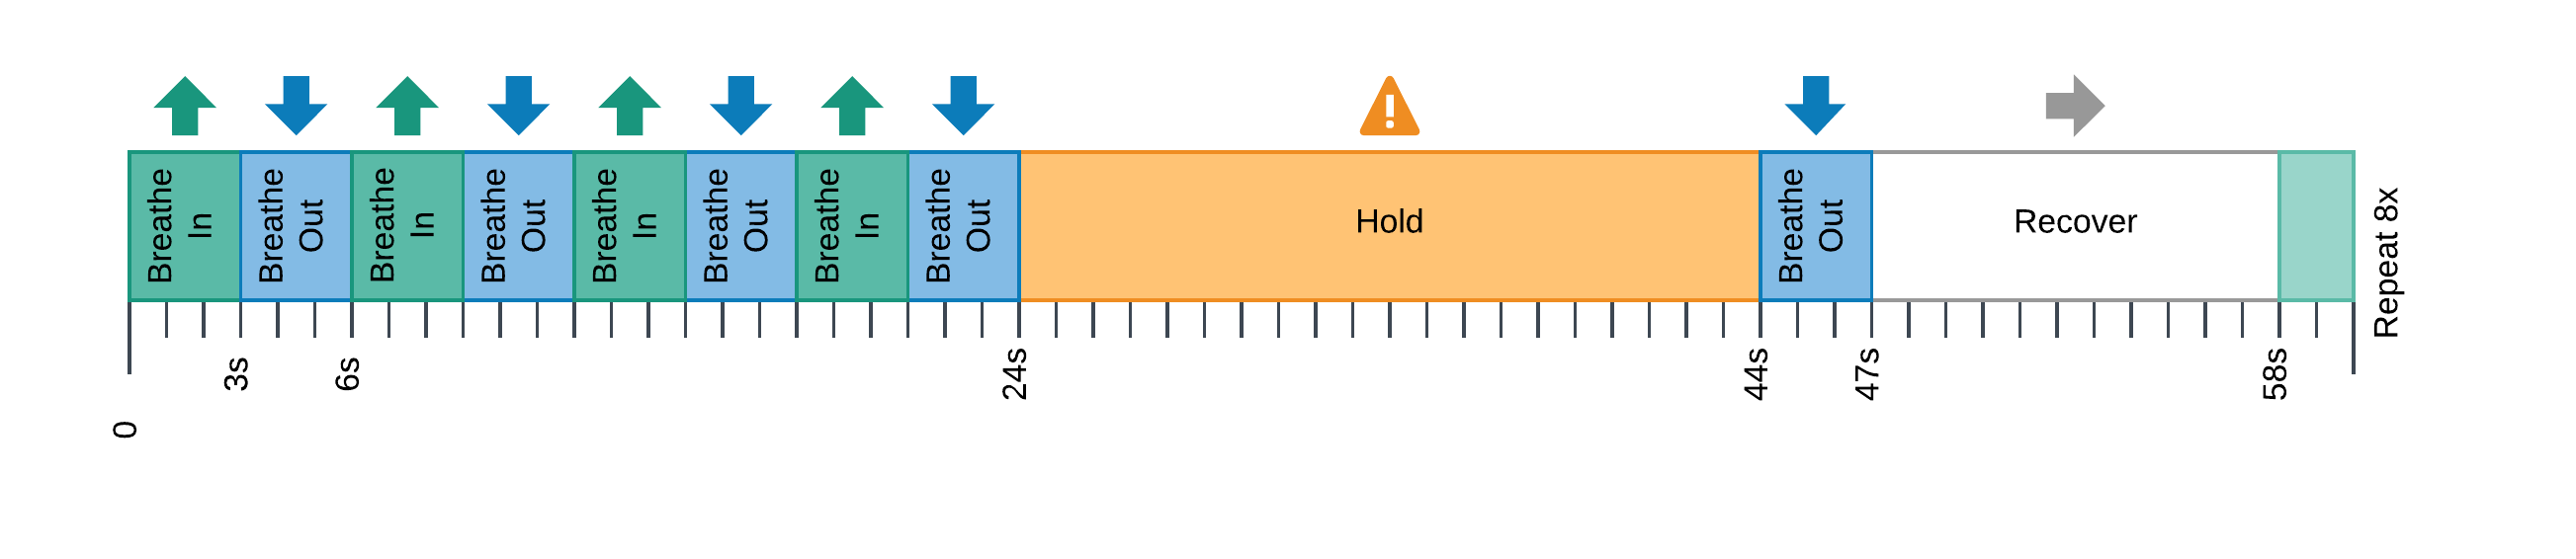
Six healthy volunteers underwent 10 MRI sessions in a 3T Siemens PrismaFit scanner, spaced 1-week apart at the same time of day. A RS and a BH task (Fig. 1) adapted from [5] were administered at each session while collecting ME-fMRI data (400 and 340 scans respectively, TR=1.5 s, TEs=10.6/28.69/46.78/64.87/82.96 ms, flip angle=70°, MB=4, GRAPPA=2, 52 slices, Partial-Fourier=6/8, FoV=211x211 mm2, voxel size=2.4x2.4x3 mm3). CO2 levels were measured during the BH task using a nasal cannula, a gas analyzer (ADInstruments), and a BIOPAC MP150 system. Data preprocessing and data analysis followed the same steps reported in [6]. Briefly, after a minimal data preprocessing, CVR and lag maps were first obtained in the Optimally Combined ME data (GLM with lagged HRF-convolved PETCO2 timeseries as covariate of interest; 12 motion parameters and Legendre polynomials as nuisance regressors). The same preprocessing was applied to the RS data, after which RS fluctuation amplitude (RSFA) was computed using AFNI’s 3dRSFC [7]. Both CVR BH and CVR RSFA maps were normalised to the MNI152 template, then the average value of 118 parcels were obtained using the Schaefer 2018 atlas (100 regions) [8] with the cerebellum and subcortical parcellation of the Destrieux 2010 atlas (18 subcortical and cerebellar regions) [9]. Due to the physiological difference between positive and negative CVR BH , voxels with positive CVR BH were analysed separately from voxels with negative CVR BH. Only those voxels that were always positive for all sessions and all subjects were considered for further analysis of positive CVR. Similarly, only those voxels that were always negative for all sessions and all subjects were considered for further analysis of negative CVR. ICC(1) [10] was computed with a custom Python based algorithm for each parcel and for each voxel adopting subjects as objects of measurements and sessions as observations. Then, spearman’s rho between CVR BH and CVR RSFA was computed for each subject across all parcels and sessions.
 Figure 1: BreathHold task.
Results
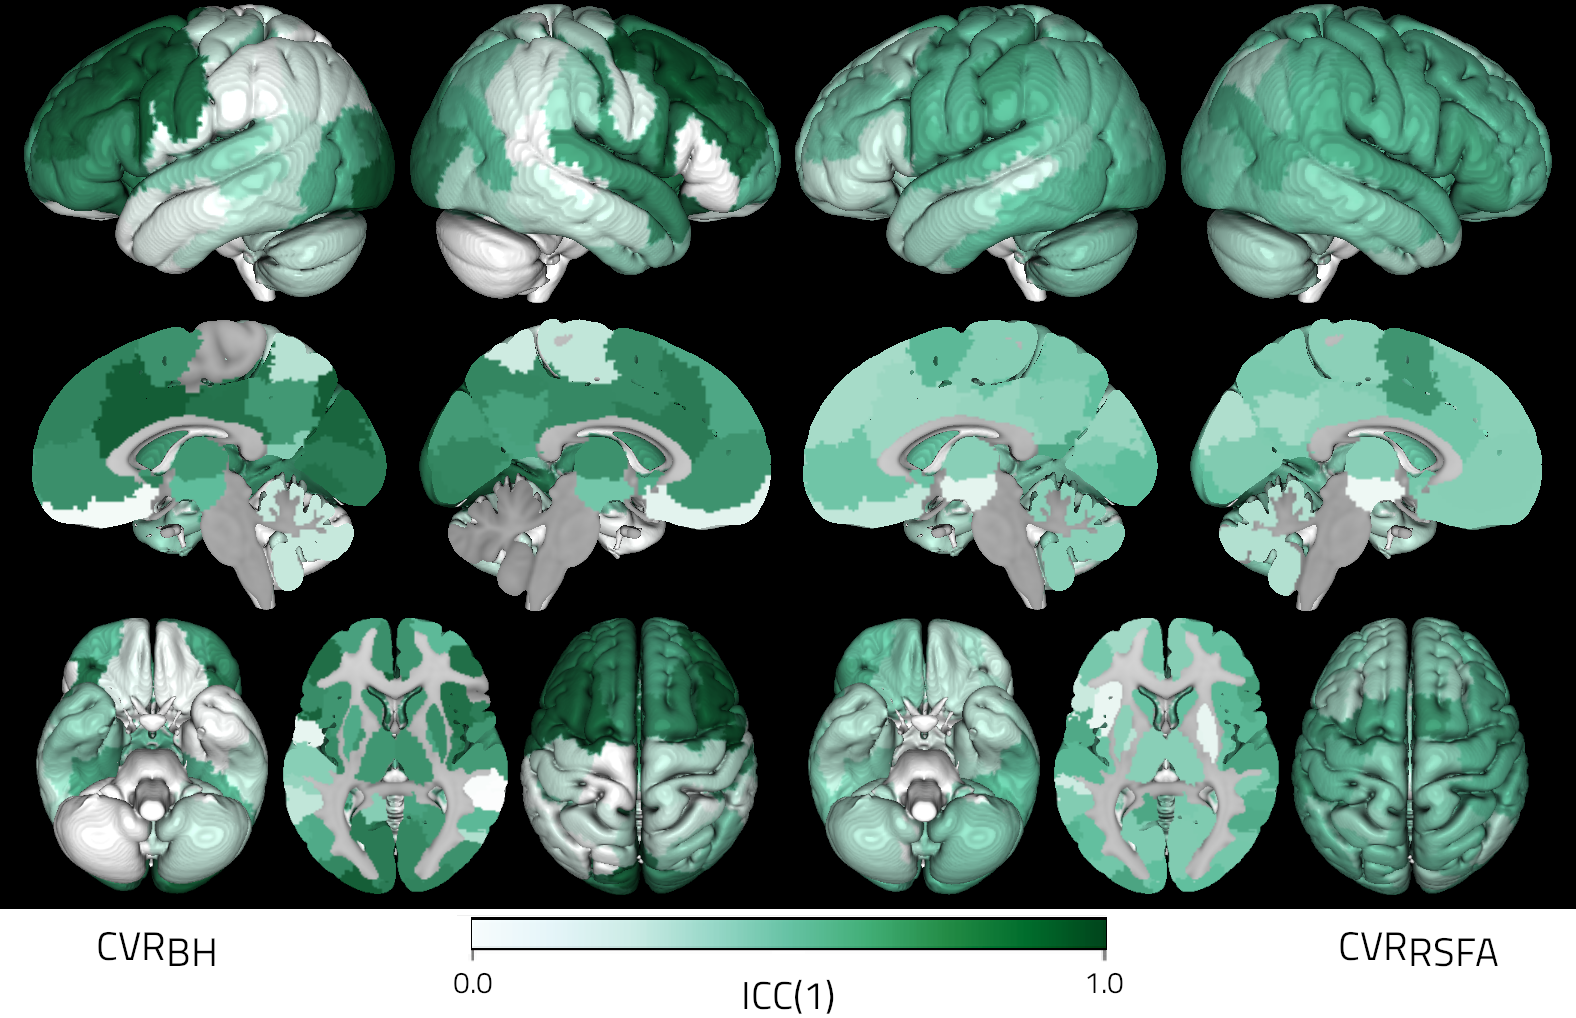
In most subjects, RSFA shows a moderate spatial correlation with both positive and negative CVR. However, this correlation varies greatly depending on the subject (Figure 2 and 3). At the voxel level, the reliability of positive CVR is systematically higher than that of RSFA (Figure 4). The same can be observed in negative CVR voxels (Figure 5). At the parcel level, the reliability of positive CVR is generally high, especially in frontal, occipital, and subcortical areas, but it shows extremely high spatial variability; RSFA has low reliability that is spatially more homogeneous. With the exception of few areas, both ICC(1) maps appear to be fairly symmetrical across hemispheres (Figure 6). Due to the little number of negative CVR voxels, such comparison couldn’t be performed on negative CVR.
 Figure 2: Positive CVR vs RSFA for each subject
 Figure 3: Negative CVR vs RSFA for each subject
 Figure 4: Above: Voxelwise ICC of positive CVR (left) and RSFA (right); Below: maps of a session of a representative subject
 Figure 5: Voxelwise ICC of negative CVR (above) and RSFA (below)
 Figure 6: ICC(1) of CVR (right) and RSFA (left)
References
- Kastrup, A., Krüger, G., Neumann-Haefelin, T., & Moseley, M. E. (2001). Assessment of cerebrovascular reactivity with functional magnetic resonance imaging: Comparison of CO2 and breath holding. Magnetic Resonance Imaging, 19(1), 13–20. https://doi.org/10.1016/S0730-725X(01)00227-2
- Liu, P., Li, Y., Pinho, M., Park, D. C., Welch, B. G., & Lu, H. (2017). Cerebrovascular reactivity mapping without gas challenges. NeuroImage, 146(November 2016), 320–326. https://doi.org/10.1016/j.neuroimage.2016.11.054
- Lipp, I., Murphy, K., Caseras, X., & Wise, R. G. (2015). Agreement and repeatability of vascular reactivity estimates based on a breath-hold task and a resting state scan. NeuroImage, 113, 387–396. https://doi.org/10.1016/j.neuroimage.2015.03.004
- Kannurpatti, S. S., & Biswal, B. B. (2008). Detection and scaling of task-induced fMRI-BOLD response using resting state fluctuations. NeuroImage, 40(4), 1567–1574. https://doi.org/10.1016/j.neuroimage.2007.09.040
- Bright, M. G., & Murphy, K. (2013). Reliable quantification of BOLD fMRI cerebrovascular reactivity despite poor breath-hold performance. NeuroImage, 83, 559–568. https://doi.org/10.1016/j.neuroimage.2013.07.007
- Moia, S., Stickland, R. C., Ayyagari, A., Termenon, M., Caballero-gaudes, C., & Bright, M. G. (2020). Voxelwise optimization of hemodynamic lags to improve regional CVR estimates in breath-hold fMRI. Accepted in Proceedings of the 42nd Annual International Conference of the IEEE Engineering in Medicine and Biology Society (EMBC), Montreal, Canada;
- Taylor, P. A., & Saad, Z. S. (2013). FATCAT: (An Efficient) functional and tractographic connectivity analysis toolbox. Brain Connectivity, 3(5), 523–535. https://doi.org/10.1089/brain.2013.0154
- Schaefer, A., Kong, R., Gordon, E. M., Laumann, T. O., Zuo, X.-N., Holmes, A. J., … Yeo, B. T. T. (2018). Local-Global Parcellation of the Human Cerebral Cortex from Intrinsic Functional Connectivity MRI. Cerebral Cortex, 28(9), 3095–3114. https://doi.org/10.1093/cercor/bhx179
- Destrieux, C., Fischl, B., Dale, A., & Halgren, E. (2010). Automatic parcellation of human cortical gyri and sulci using standard anatomical nomenclature. NeuroImage, 53(1), 1–15. https://doi.org/10.1016/j.neuroimage.2010.06.010
- Mcgraw, K. O., & Wong, S. P. (1996). Forming Inferences About Some Intraclass Correlation Coefficients. Psychological Methods, 1(1), 30–46. Retrieved from papers2://publication/uuid/D94ABE24-4E43-4996-83B0-32BE18139462